-year-old retail investor from Bengaluru.
Trying to beat Jane Street with a kite account :)
Bull & Bear Chronicles
About Me
19-year-old student, genuinely obsessed with learning new tech and building things that actually work. I can vibecode a full-stack application from scratch. I manage a personal stock portfolio at 30%+ XIRR, run Google Ads campaigns for high ROI, and live inside Excel. I love studying how companies navigate crisis, figuring out where things broke and why. Equal parts creative and analytical, raised in Bengaluru, which means survival requires fluency in at least four languages :)
What I Do
Actively manage a ₹10L+ diversified stock & MF portfolio.
Writing on economics, finance, and market trends — with data to back it up.
Skills
Experience
Member · Tech & Innovation Club
Social Internship · Joining May 2026
Education
Bachelor of Business Administration (BBA)
Certifications & Awards
// ECAs Maxxxingg
ISSUED BY DMS IIT DELHI · MARCH 2026
2nd Runners Up at IIT Delhi's Excelerate '26 out of ~1,320 teams. National Level Excel data analytics competition testing speed, accuracy, and formula-based problem solving under pressure.
ISSUED BY IIM INDORE · JAN 2026
National Finalist, B2C (Marketing Case Competition) Iris'26 — IIM Indore · Top 30 out of 1,654 teams · Invited to final offline round at IIM Indore campus · Competed as first-year undergraduates against MBA-level candidates
Availability
Looking for internship opportunities from May to July 2026. Open to part-time and full-time roles.
Portfolio Dashboard
Equities
Blinkit was growing faster than food delivery ever did. The market priced a food app. I bought a quick commerce company hiding inside one.
Gold appreciation was the thesis. The 2.5% annual interest was just free money on top. Better than physical gold in every measurable way.
Best SUVs in the segment, strong fundamentals, and an EV lineup that actually shipped. Most auto companies promise an EV future. M&M delivered one.
India is massively underpenetrated on air travel. IndiGo has 60%+ market share and no serious domestic competitor left standing. A market structure bet more than a company bet.
Every retail investor who opens a Zerodha or Groww account eventually touches BSE infrastructure. Bet that the retail explosion was structural, not a pandemic fluke. And it wasn't.
Every vehicle on Indian roads needs new tyres every few years regardless of the economy. The replacement market is massive, recurring, and largely ignored. CEAT has been quietly taking share.
Real estate arm sitting on prime land parcels across Mumbai with strong execution on residential launches. Apparel funds operations while realty does the heavy lifting on value creation.
Two businesses that would each be Nifty 50 companies on their own. Jio owns India's digital infrastructure. The refinery is one of the largest in the world. The stock underperformed but the businesses didn't.
The incubator for everything Adani touches next. Airports, green hydrogen, data centres, roads — all pass through here before becoming standalone listed companies. Buying early access to India's infrastructure pipeline.
India is quietly becoming the diabetes and obesity capital of the world. Sun Pharma's GL0034 (Utreglutide) is a homegrown long-acting GLP-1 agonist sitting on a market that hasn't even formed yet. Holding through the red.
They make good cars. Thesis didn't work out.
Mutual Funds
Writing
Insights on economics and finance.
07 OCT 2025 — RESEARCH
A data-driven deep dive into India's Global Capability Centre landscape — growth, talent, real estate, and city comparisons.
FEB 2026 — ANALYSIS
A data-driven deep dive into OpenAI and Anthropic's finances — revenue, burn rates, and the path to profitability.
COMING SOON
COMING SOON
Research Report · 07 Oct 2025
A Global Capability Centre (GCC) is an office set up by a multinational company in India to handle their internal work like tech, finance, and analytics. Unlike outsourcing, the parent company fully owns it.
Examples: JPMorgan's tech hub in Mumbai, Goldman Sachs in Bengaluru, Microsoft's R&D centre in Hyderabad, Boeing's engineering centre in Bengaluru.
National Market Overview
India's GCC sector is transitioning from a cost-centric hub to a strategic global innovation centre.
City Deep Dive
Analysis · Feb 2026
OpenAI and Anthropic are the two most valuable AI startups on Earth. Together they've raised over $60 billion. Neither has turned a profit. Here's why that's about to change.
The Billion-Dollar Bonfire
In the first half of 2025 alone, OpenAI posted a $13.5 billion net loss — burning roughly $575,000 every hour. Anthropic, while more restrained, still burned through $3 billion in 2025. The AI industry's two flagship companies are haemorrhaging cash at a pace that makes the dot-com era look frugal. But unlike Pets.com, these companies have revenue — and it's growing at an unprecedented clip.
OpenAI tripled revenue from $3.7B (2024) to $13.1B (2025), driven by ChatGPT's 900 million weekly users and aggressive enterprise expansion. Anthropic's trajectory is even steeper — from $1B to $9B in the same period, a 9x leap fuelled almost entirely by enterprise API adoption. By February 2026, Anthropic's annualized run-rate hit $14B, with Claude Code alone generating $2.5B — more than most public SaaS companies earn in total.
Where the Money Comes From
The two companies pursue fundamentally different revenue strategies. OpenAI is consumer-first — ChatGPT subscriptions drive the bulk of revenue, supplemented by API sales and a growing enterprise segment. Anthropic is enterprise-first — 80% of its revenue comes from business customers, with over 300,000 companies using Claude and 500+ spending more than $1M annually.
This distinction matters enormously. Enterprise contracts are stickier, more predictable, and higher-margin than consumer subscriptions. Anthropic generates $2.10 per compute dollar versus OpenAI's $1.60, according to Fortune. OpenAI's diversification into video generation (Sora), web browsing (Atlas), hardware (with Jony Ive), and even robotics demands huge capital. Anthropic has deliberately avoided these expensive adjacencies, focusing compute on its core Claude models.
Where the Money Goes
AI doesn't run on hope. It runs on GPUs — thousands, then millions of them — packed into data centres consuming as much electricity as mid-sized cities. Training a frontier model costs north of $100M. Inference costs scale with every query. And talent? Senior AI researchers command equity packages worth millions.
In H1 2025, OpenAI spent $6.7B on R&D, $2B on sales & marketing (nearly double the entire 2024 budget), and $2.5B on stock compensation. The compute margin — revenue after model-running costs — improved from 52% (Oct 2024) to 70% (Oct 2025), a strong signal that unit economics are heading in the right direction. But with OpenAI committing to ~$600B in total compute spend by 2030, the upfront infrastructure bet is enormous.
The Great Divergence
Here's where it gets interesting. Both companies burn cash today, but their paths to profitability are dramatically different.
Burn rate drops to ~33% in 2026, ~9% by 2027. Positive cash flow expected by 2027–2028. Projected $17B cash flow by 2028.
Burn stays at ~57% through 2027. $74B operating loss projected for 2028. Cash flow positive targeted for 2029–2030. Needs ~$207B more in capital.
OpenAI will burn through roughly 14x as much cash as Anthropic before turning a profit. That's the cost of building a consumer empire spanning chatbots, video, browsers, hardware, and robotics. Anthropic's laser focus on enterprise AI keeps costs tightly coupled to revenue growth.
When Do They Make Money?
The Bigger Picture
The global AI market crossed $390B in 2025 and is projected to exceed $3.4 trillion by 2033, growing at 30%+ CAGR. Enterprise AI adoption alone hit $115B in 2026. This isn't a niche — it's becoming the infrastructure layer for the entire global economy. The question isn't whether AI as an industry will be profitable. It's whether the current frontrunners will capture enough of that value to justify the investment.
The Wild Card: DeepSeek
In January 2025, Chinese lab DeepSeek released a model competitive with OpenAI's best — trained for just $5.9 million versus OpenAI's $100M+. Nvidia lost $600B in market cap in a single day. DeepSeek's models are now priced at 1/4th to 1/6th of comparable US systems. If training costs continue to plummet, the "you must spend tens of billions to compete" thesis collapses — and that's good news for profitability. Cheaper models = higher margins for everyone.
Conclusion: Yes, AI Will Be Profitable
The losses are real, but so is the trajectory. Here's why profitability is a question of when, not if:
OpenAI's compute margin went from 52% to 70% in one year. Better hardware (next-gen chips), better algorithms (distillation, quantisation), and competition from DeepSeek are all driving inference costs down. This is the single biggest lever for profitability.
78% of companies now use AI in at least one business function. 8 of the Fortune 10 use Claude. This isn't hype-driven trial usage — it's operational integration. Enterprise contracts are sticky and high-margin.
Anthropic grew revenue 9x in 2025 while reducing cash burn from $5.6B to $3B. OpenAI tripled revenue while burn grew less than 2x. The crossover point is mathematically inevitable at these growth rates.
The AI market is projected to hit $3.4 trillion by 2033. Even capturing 5–10% of that gives these companies revenue in the hundreds of billions — more than enough to cover infrastructure costs at scale.
Amazon lost money for 9 years. AWS alone now generates $100B+ annually. Netflix burned billions on content before becoming consistently profitable. The pattern of heavy upfront infrastructure investment followed by margin expansion is the defining playbook of transformative tech companies.
AI will be profitable. Anthropic will likely get there first (2027–28).
OpenAI's path is longer and riskier, but the scale of the payoff — $280B revenue by 2030 — justifies the bet.
The companies burning cash today are building the infrastructure layer of the next economy.
Sources
Coming Soon
This post is being written. Check back soon.
Coming Soon
This post is being written. Check back soon.
Project
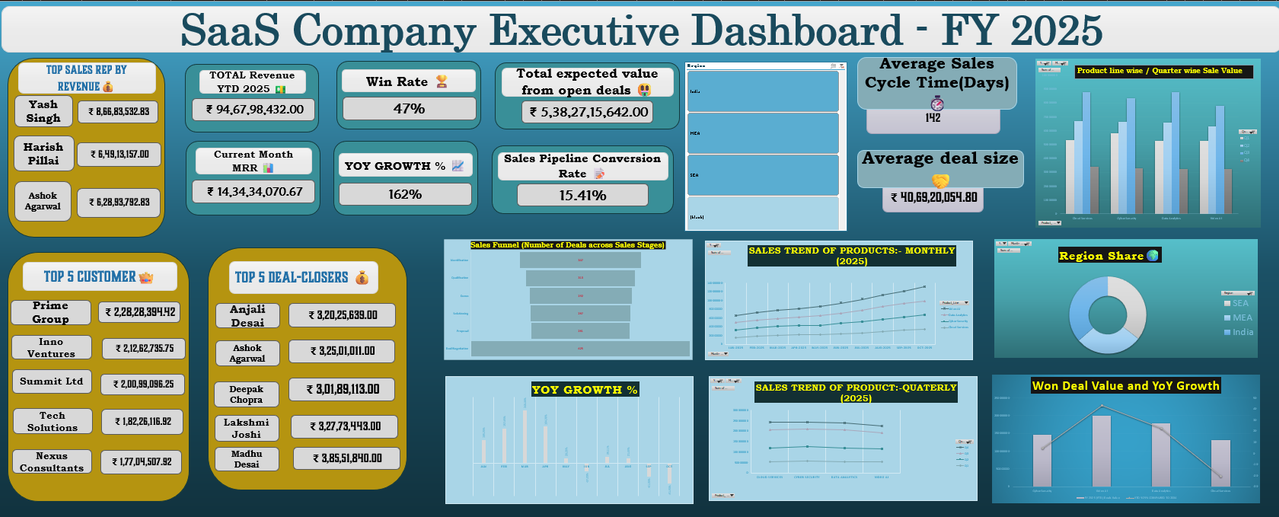
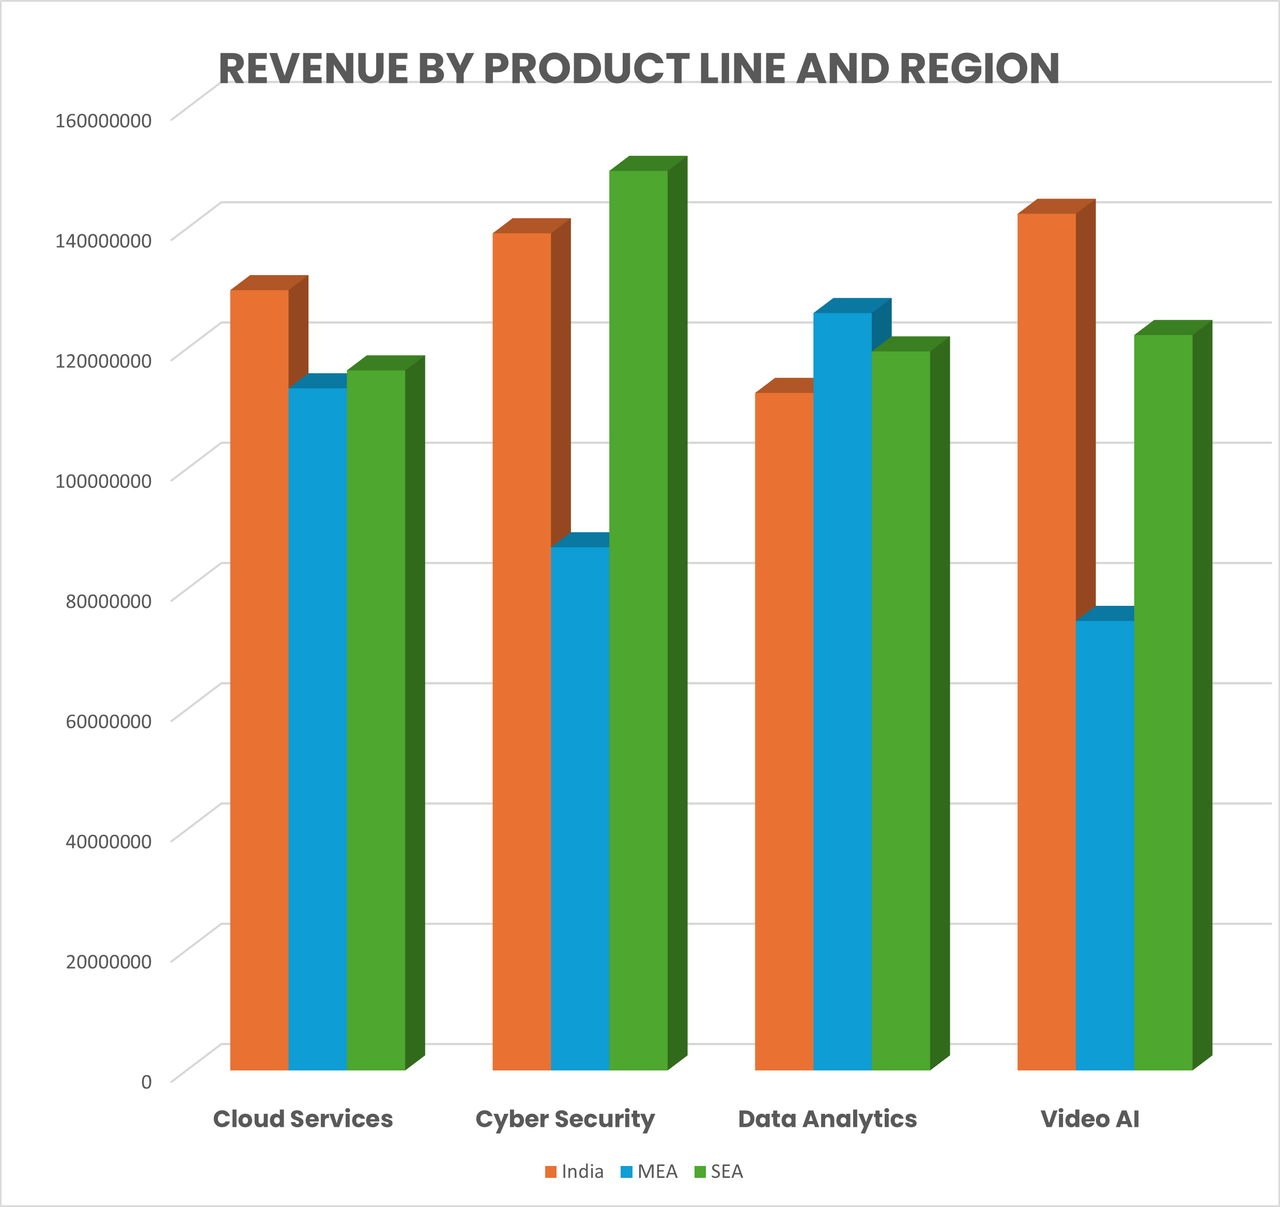
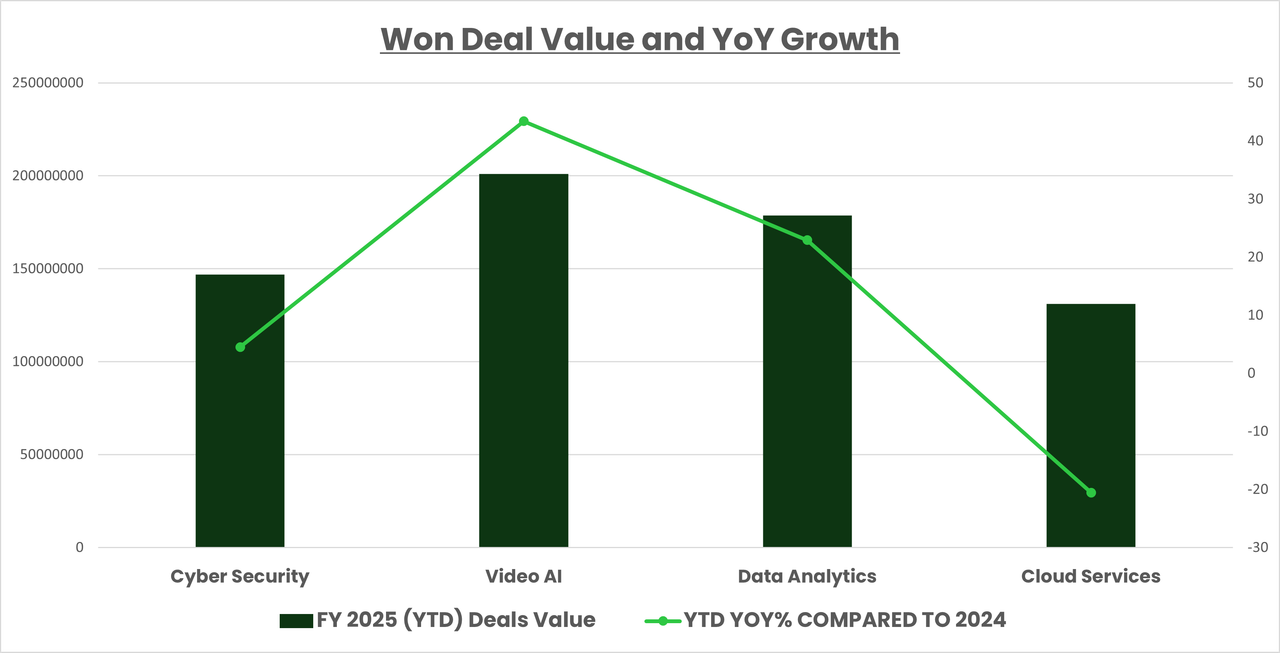
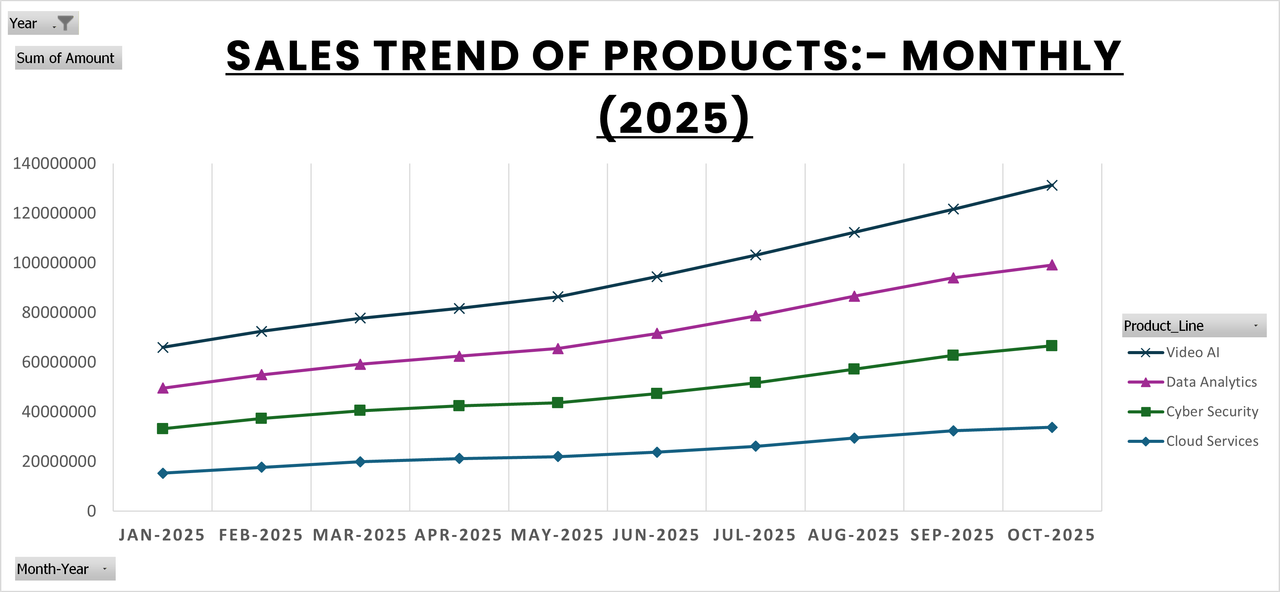
Built a fully interactive Excel dashboard for a SaaS company operating across India, MEA, and SEA — spanning 4 product lines (Video AI, Cloud Services, Cyber Security, Data Analytics) with 22 months of operational data.
Dashboard Preview
The Problem
Raw data across 9 interconnected sheets — Revenue, Sales Pipeline, Contracts, Invoices, Employees, Clients, Support Tickets, Marketing Campaigns, and Sales Targets — with no unified view for management decision-making.
What I Built
A single-sheet executive dashboard with real-time region filtering across every metric. Key modules covered:
Quarterly YoY growth by product line, YTD revenue, October MRR from active contracts.
Won deal value by region and product, top 5 sales reps ranked by target achievement %, average sales cycle length.
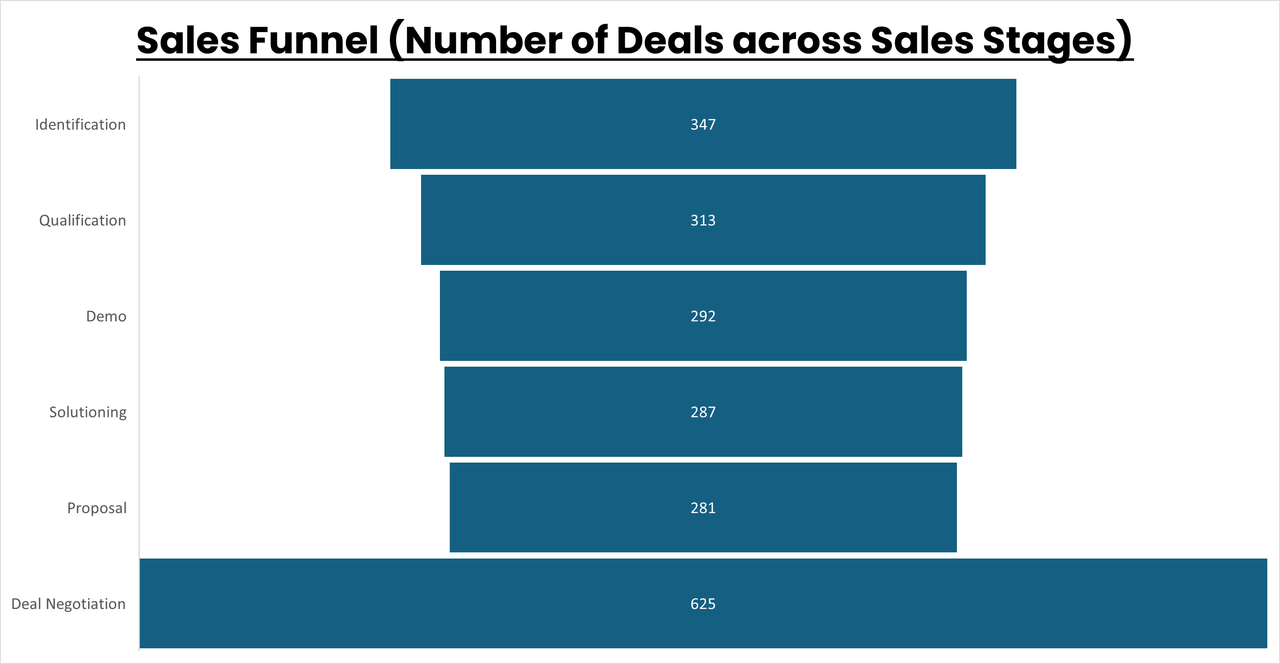
Open deal aging by stage, probability-weighted expected pipeline value (stage-based win probabilities from 10% to 60%).
Product-level sales trend analysis showing volume and revenue patterns across the product catalog over time.
Top 10 clients ranked by revenue, closed deal value, and active MRR.
Won deal values tracked over time with year-over-year growth analysis to identify momentum shifts and seasonal patterns.
Contracts expiring within 5 months with account manager mapping.
Technical Highlights
Dynamic region filter using Slicers connected to all PivotTables and KPI cells simultaneously.
XLOOKUP / INDEX-MATCH across 9 relational sheets using Client_ID, Employee_ID, Campaign_ID as keys.
Calculated columns: Deal Age, Days in Current Stage, Sales Cycle Length, Days Overdue, Resolution Time, Contract Status (Active/Expired).
Combo charts (bar + line) for quarterly revenue vs YoY growth, sales funnel visualization, MRR trend lines across products.
Conditional formatting with data bars on industry-product cross-tabulations.
Key Findings
Cloud Services contributed the highest MRR in October 2025 across all regions.
Client Referral had the highest win rate among all deal channels.
A significant percentage of support managers had a majority client base outside their assigned region.
Tools Used
Microsoft Excel — PivotTables, XLOOKUP, INDEX-MATCH, Data Validation, Slicers, Combo Charts, Conditional Formatting, Data Bars.
Work
Things I've built.
End-to-end Excel dashboard built from raw operational data across sales, revenue, HR, and marketing. Turned 9 disconnected sheets into an executive-ready view with live region filtering.
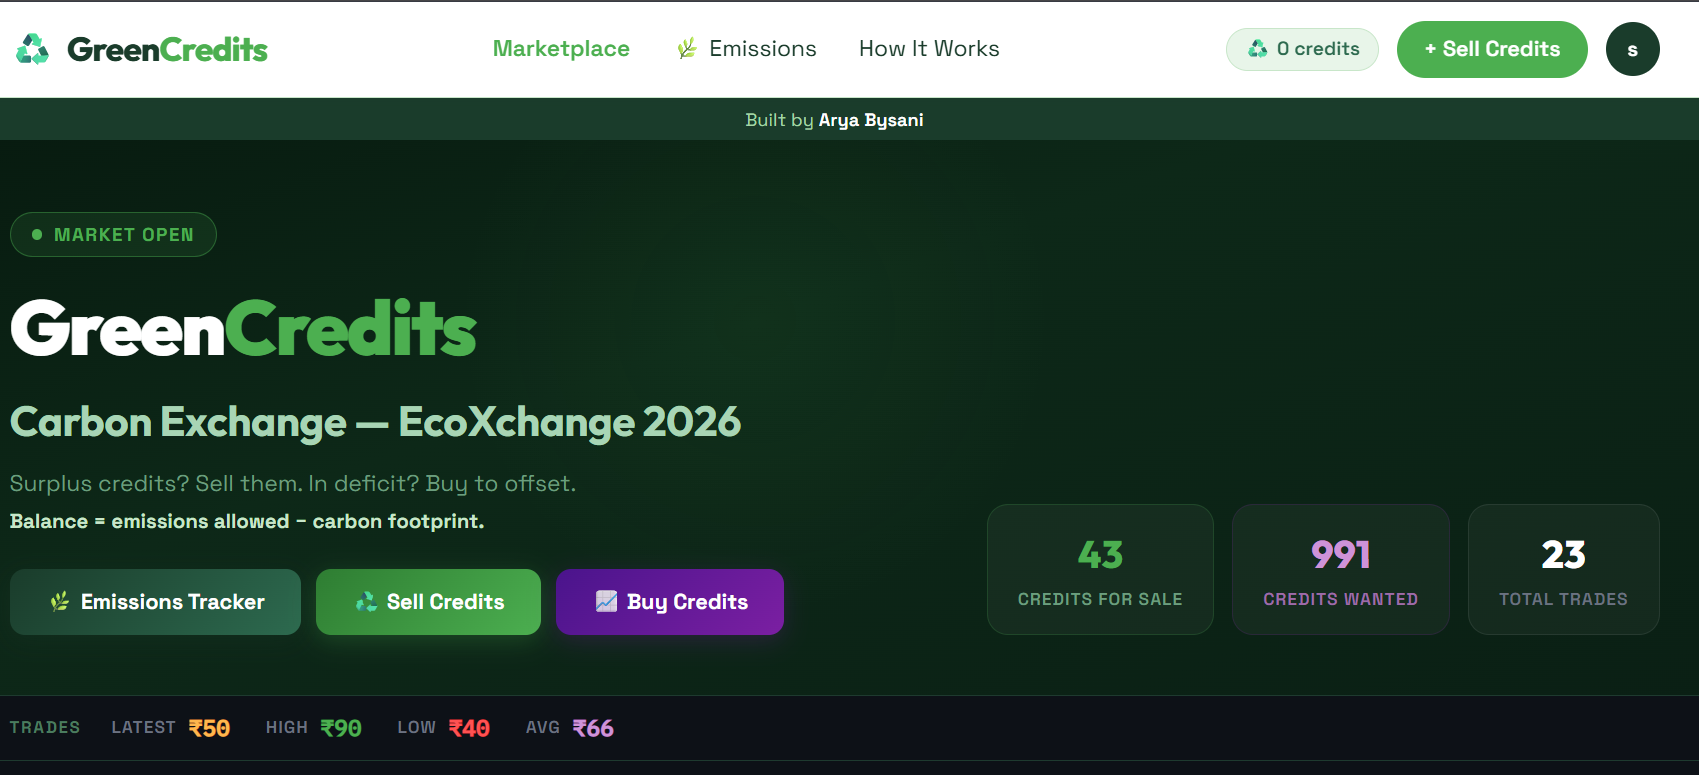
Real-time order book trading platform for carbon credits, built for TAPMI's classroom trading session. Buy and sell orders match instantly on placement — like a stock exchange, not a batch auction.
Project · Full Stack
A real-time order book trading platform built for TAPMI's classroom carbon credit auction. Teams log in and trade carbon credits against each other — buy and sell orders match instantly on placement, the same way a stock exchange works.
The Problem
TAPMI runs a classroom simulation where student teams trade carbon credits with each other. The existing process was manual — no real-time price discovery, no order matching, no live portfolio tracking. I built the infrastructure to run it like an actual exchange.
What I Built
Orders match immediately on placement — no batch auction. Sell orders match against the highest bids first; buy orders match against the cheapest asks first. Settlement price is always the seller's ask. Partial fills are fully supported on both sides.
Every order goes through five checks: authenticated session, trading enabled by admin, account not banned, carbon balance set, and sufficient balance for sells. Credits are escrowed immediately on sell order placement.
Admin can open and close trading with a single toggle, set each team's opening carbon balance, and ban accounts. A system_settings table with a single trading_active flag gates all order placement across the platform.
Five Postgres tables via Supabase: teams, listings (sell orders), buy_orders, transactions (every completed trade), and system_settings. Order statuses track the full lifecycle: live → sold, open → partial → filled.
Stack
FRONTEND
Next.js (App Router)
DATABASE
Supabase + Postgres
DEPLOYMENT
Vercel
AUTH
Supabase Auth