Project
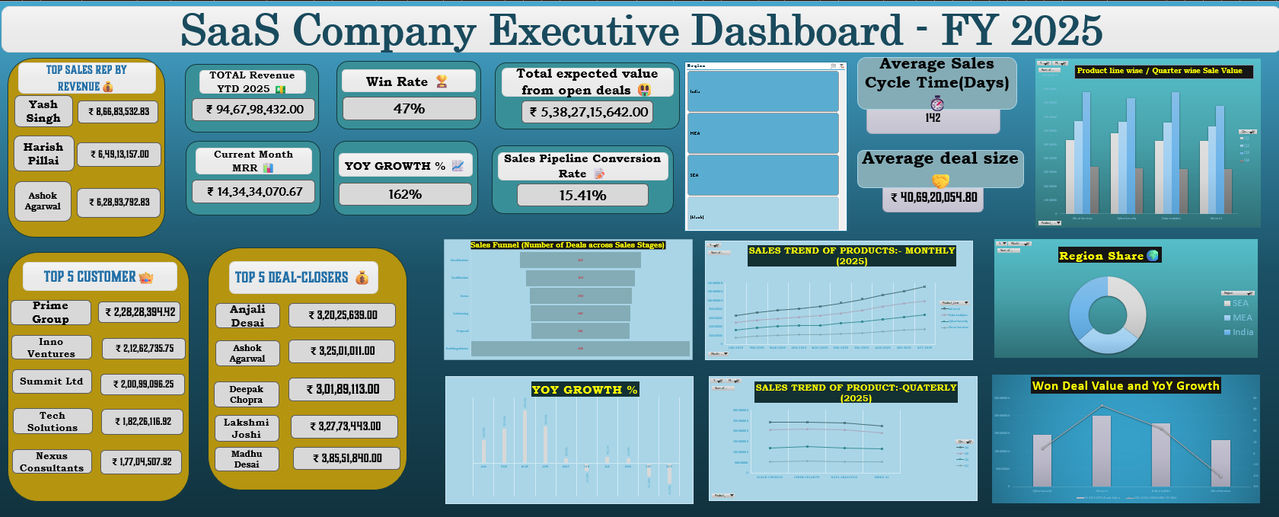
SaaS Business Intelligence Dashboard
Built a fully interactive Excel dashboard for a SaaS company operating across India, MEA, and SEA — spanning 4 product lines (Video AI, Cloud Services, Cyber Security, Data Analytics) with 22 months of operational data.
Dashboard Preview
The Problem
Raw data across 9 interconnected sheets — Revenue, Sales Pipeline, Contracts, Invoices, Employees, Clients, Support Tickets, Marketing Campaigns, and Sales Targets — with no unified view for management decision-making.
What I Built
A single-sheet executive dashboard with real-time region filtering across every metric. Key modules covered:
Quarterly YoY growth by product line, YTD revenue, October MRR from active contracts.
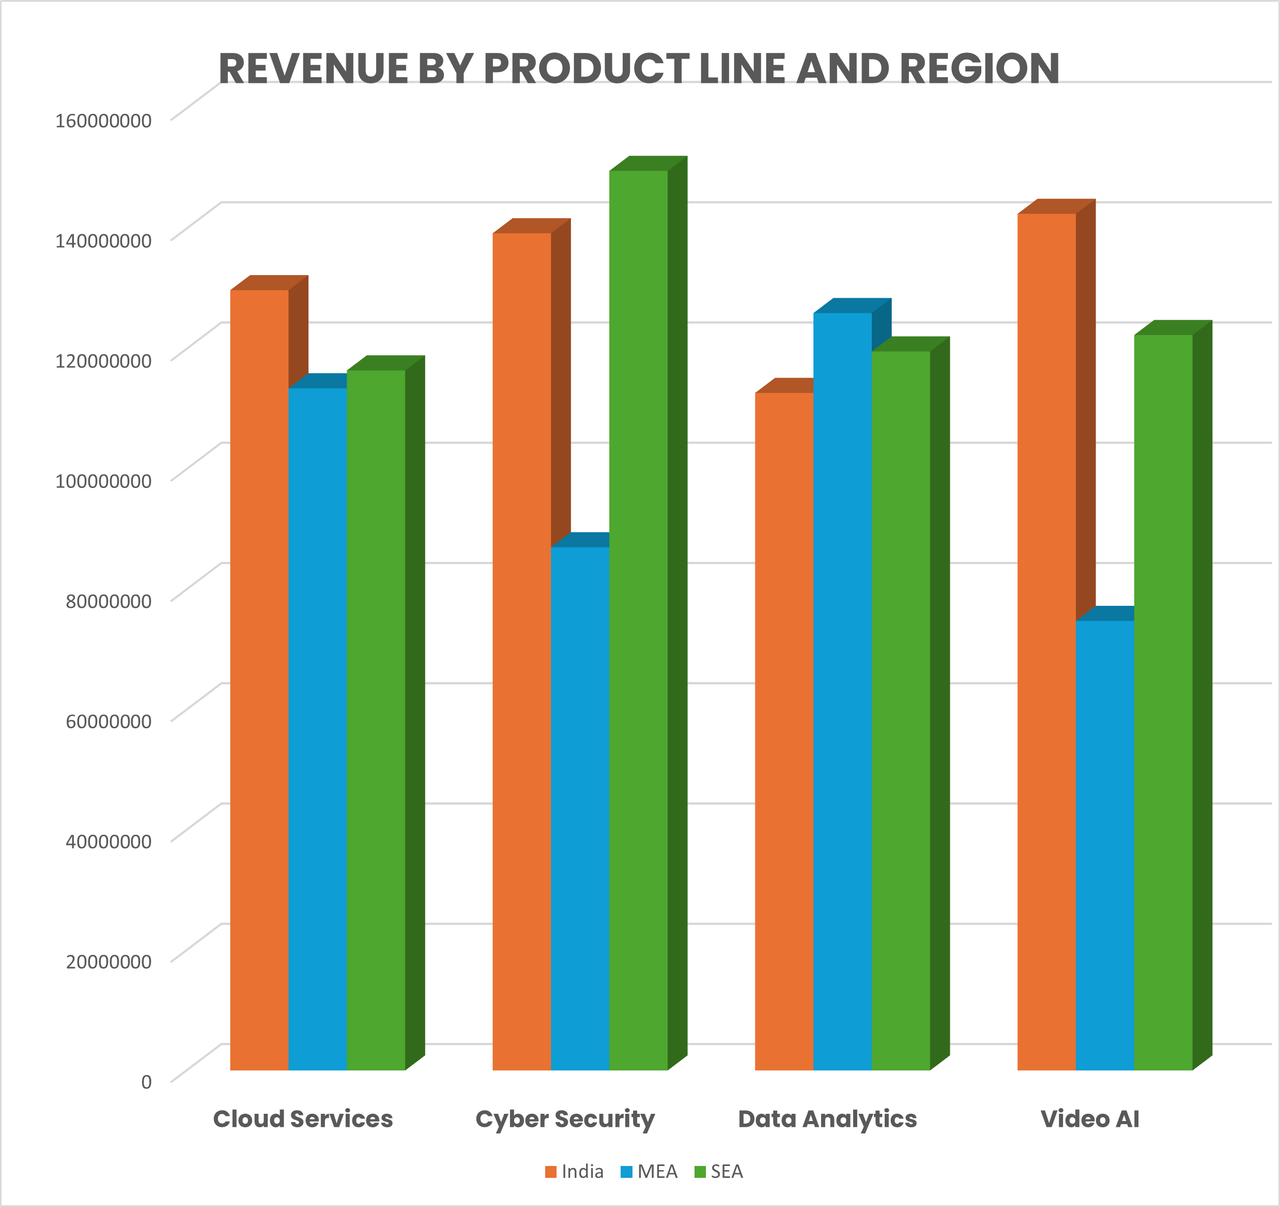
Won deal value by region and product, top 5 sales reps ranked by target achievement %, average sales cycle length.
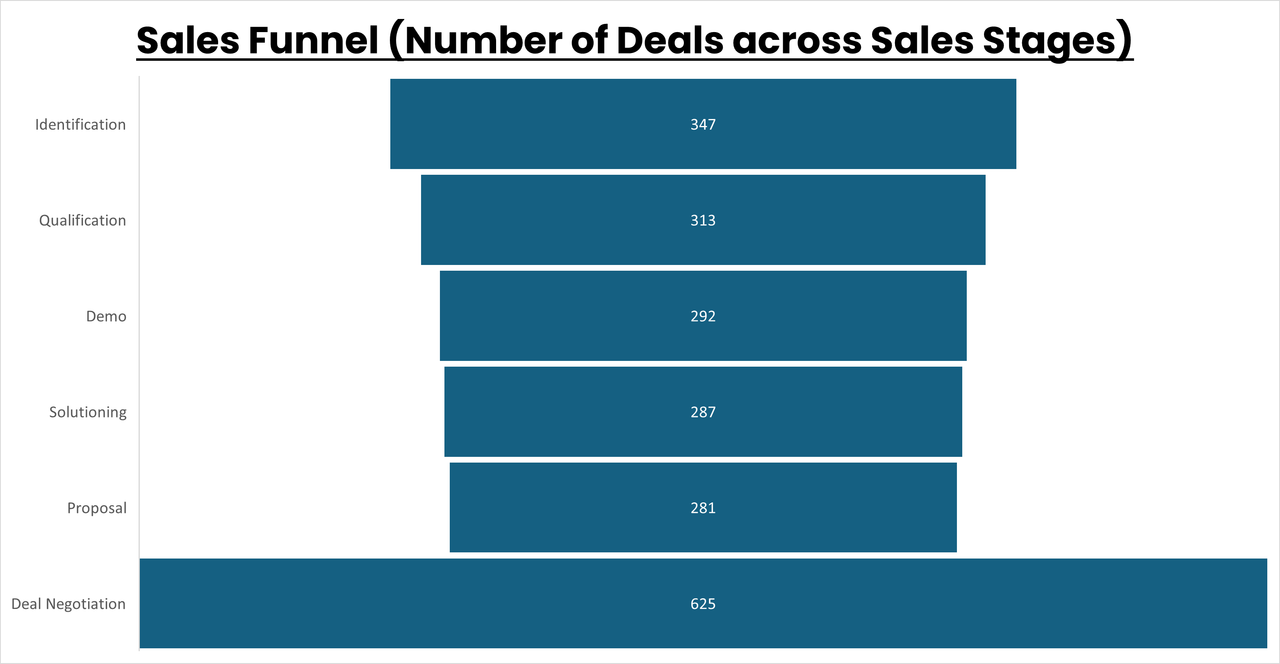
Open deal aging by stage, probability-weighted expected pipeline value (stage-based win probabilities from 10% to 60%).
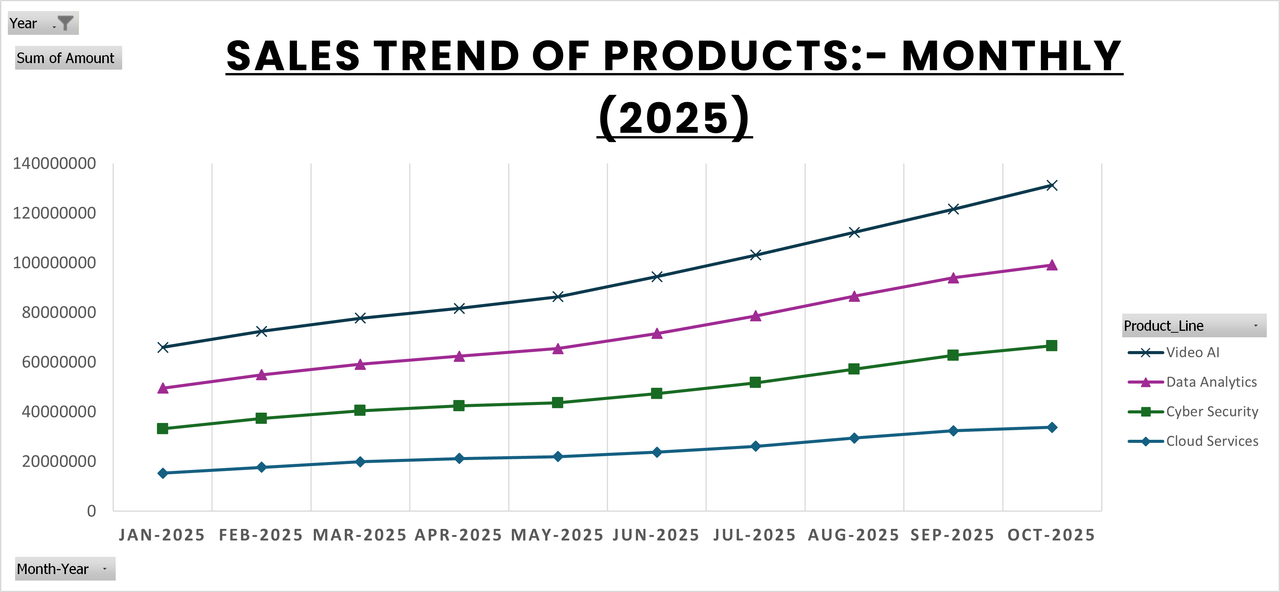
Product-level sales trend analysis showing volume and revenue patterns across the product catalog over time.
Top 10 clients ranked by revenue, closed deal value, and active MRR.
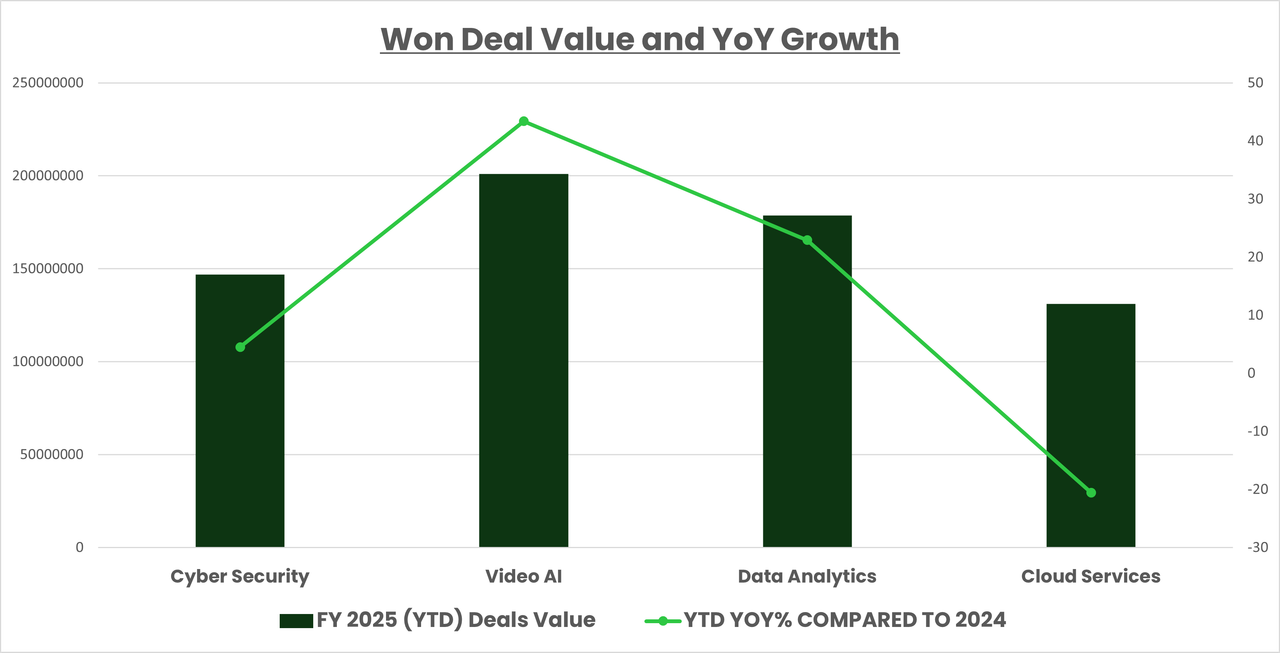
Won deal values tracked over time with year-over-year growth analysis to identify momentum shifts and seasonal patterns.
Contracts expiring within 5 months with account manager mapping.
Technical Highlights
Dynamic region filter using Slicers connected to all PivotTables and KPI cells simultaneously.
XLOOKUP / INDEX-MATCH across 9 relational sheets using Client_ID, Employee_ID, Campaign_ID as keys.
Calculated columns: Deal Age, Days in Current Stage, Sales Cycle Length, Days Overdue, Resolution Time, Contract Status (Active/Expired).
Combo charts (bar + line) for quarterly revenue vs YoY growth, sales funnel visualization, MRR trend lines across products.
Conditional formatting with data bars on industry-product cross-tabulations.
Key Findings
Cloud Services contributed the highest MRR in October 2025 across all regions.
Client Referral had the highest win rate among all deal channels.
A significant percentage of support managers had a majority client base outside their assigned region.
Tools Used
Microsoft Excel — PivotTables, XLOOKUP, INDEX-MATCH, Data Validation, Slicers, Combo Charts, Conditional Formatting, Data Bars.